| 기술적 분석이란 가격 변화의 미래를 예측하기 위해서 차트 테크닉을 활용하는 것이다. 1, 미래 가격 변동의 예측을 위해 비슷한 상황에서의 과거 반응을 활용한다. 2, 기술적 분석에서는 오직 가격의 등락만이 고려할 사항이다. 그 외 뉴스나 수익 같은 정보들은 신경쓰지마라. |
차트를 공부하는 동안 뉴스를 무시하라는 것에서 놀랄 수도 있지만 John J. Murphy는 그의 책에서 왜 그래야 하는 지 말해준다. 짧게 말해 가격이 모든 것에 우선한다. 자산의 시장 가격은 이미 모든 중요한 뉴스가 반영되어 있는 것이다.
시중에 도는 뉴스나 정보, 다른 쓸만한 분석 같은 것들은 이미 가격에 영향을 주었고 그러므로 가격이란 모든 중요 정보의 집합인 것이다.
기술적 분석은 가격에 관한 연구이므로 가격을 연구하는 것으로 모든 중요 사항을 이미 고려하고 있다고 볼 수 있다.
캔들
기술적 분석의 시작과 끝은 캔들이다.
캔들의 명확한 이해가 트레이딩에는 필수이다.
캔들이란 주제는 방대하지만 우리가 가져가야 할 기본적인 것은 얼마 되지 않는다.

백가지가 넘는 캔들이 있어서 공부를 하자면 끝도 없겠지만, 초반에는 두 가지 중요한 캔들을 이야기하려고 한다. 망치형와 장악형
망치형 – 단순하게 말해서 아래에서 올라와 몸통은 짧고 꼬리가 긴 캔들이다. 바닥일 가능성이 있는 곳에서 나타날 수 있다.

장악형- 다음 캔들에서 반대 방향으로의 급격한 변동으로 인해 추세가 확정된 후에 나타난다
다음 예를 보자.

이 캔들을 공부하면서 기본적인 개념이란 긴 꼬리를 가진 캔들은 매수 쪽이 상당한 매도에도 불구하고 매수로 가격을 올려버리는 것에 성공했다는 것이다. 짧은 몸통에 긴 꼬리의 캔들은 물량을 받아 먹었음을 의미한다.

비슷하게 긴 꼬리가 위에 있고 짧은 몸통의 역망치는 하락추세이고 매수 쪽이 가격을 올리려 해도 쏟아지는 물량이 너무 많은 것이다.

위 두 가지 형태에 우리는 이렇게 결론을 내릴 수 있다. 몸통이 짧고 위나 아래로 긴 꼬리를 가지고 있는 캔들은 시장이 안정되지 않고 혼란스러움을 나타내는 것이다. 추세가 반전될 수도 있고 추세 끝을 의미하는 경고로 받아들일 수도 있다.
이번 장에서 우리는 가능성이 높은 곳에서 진입하기 위해 차트에 매도와 매수 구간을 익힐 것이다. 이번 장을 배우고 다른 거 하기 전에 차트를 열어서 매수와 매도 구간을 확인 하는 연습을 해보자.
캔들을 이용해서 매수와 매도 찾기
일정 기간 내 가격 변동을 확인 하는 것 외에도 캔들은 매수와 매도 구간 확인을 위해 사용할 수 있다. (매수 매도 구간은 지지 저항과는 다르다.)
매수 매도 구간에는 다수의 진입 힌트도 있기 때문에 매수 매도 확인을 위한 캔들 활용은 수익률 높은 진입 지점을 찾는, 가능성이 높은 방법이다. 매수 매도 구간을 확인한 후에는 힌트 속에서 진입 지점을 찾아 들어가는 것이 목표이다.
캔들을 활용해서 매수 매도 눌림 찾기
캔들로 매수 매도 눌림을 찾을 수 있다. 특히 일단위 데이 트레이딩에 있어서 나는 이 챕터가 당신의 관점과 캔들 활용을 바꿔 줄 수 있었으면 한다.
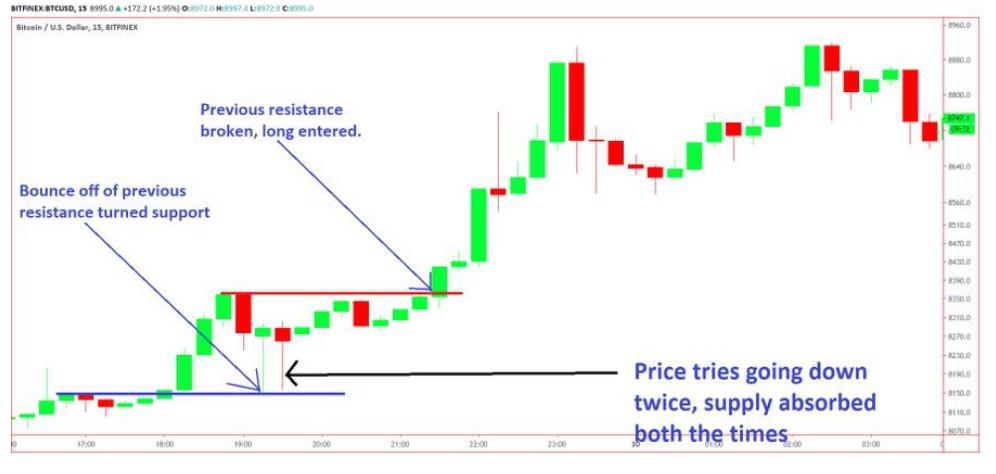
긴 꼬리를 가진 캔들이 두 세번 나오면 매도세를 극복한 것이다. 이 말은 이 캔들 아래 엄청난 매도 물량을 다 받아 먹었다는 것이고 이러면 일반적으로 상승이다. 이 부분에서의 매수가 매도를 압도 할 수 있었으니까.
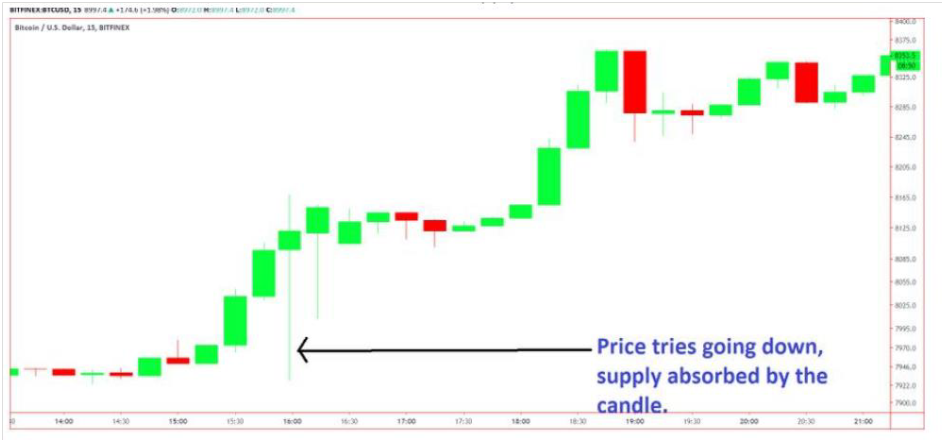
이 지점에서 트레이더는 안전한 롱 진입 지점을 찾을 수 있을 것이다.
1, 긴 꼬리를 가진 캔들을 찾아라
2, 이전 저항선에서 튀어 올라와 지지선이 되어있어야 한다.(지지와 저항에 관해서는 다음 장에서 배울 것이니 지금은 매수와 매도 구간에 집중해라.)
3, 가격이 저항선을 위로 상승하길 기다려라.

비슷한 방식으로 윗꼬리 달린 캔들을 활용 할 수 있다.
위에 있는 매도 물량을 전부 받아 먹지 못했으니 일반적으로 하락을 의미한다.
이 부분에서 반전 신호를 찾아야 한다.
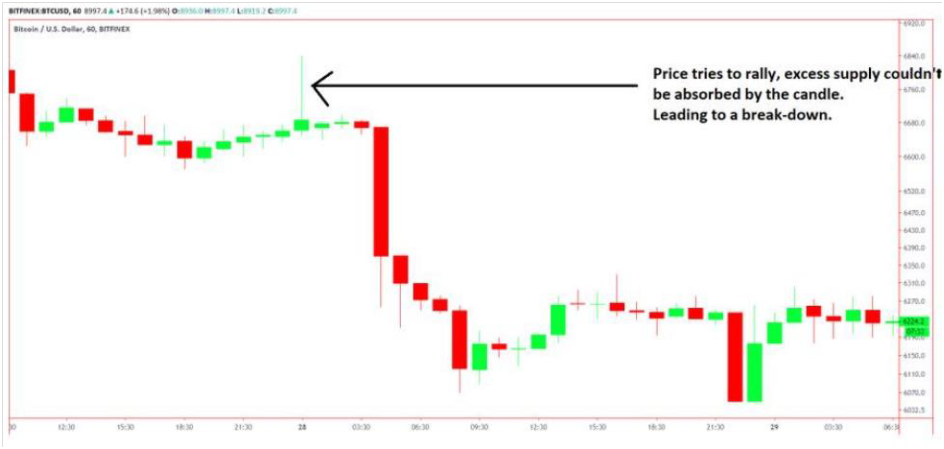
마찬가지로 물량 받아먹기를 실패한 캔들이 확정되면 숏 진입 시점이 나올 수 있다.
1, 윗꼬리 긴 캔들을 찾아라
2, 이전 지지선이 꺠지길 기다려라.
아래 사진에서 숏 진입 지점을 보자.

확정- 트레이딩에서 확정은 진입을 위한 긍정적인 신호이다.
예- 마지막 캔들이 상승으로 보이고 확정이 되면 안전한 진입은 다음 캔들의 가격이 이전 캔들의 고점을 넘어갔을 때이다.
리테스트- 저항선을 깨고 올라간 이후, 저항선이었던 곳으로 돌아온다. 이전 저항선이 이제는 지지선이 되어버린 것이다.
다음 개념을 활용하며 트레이딩을 이해해보자.

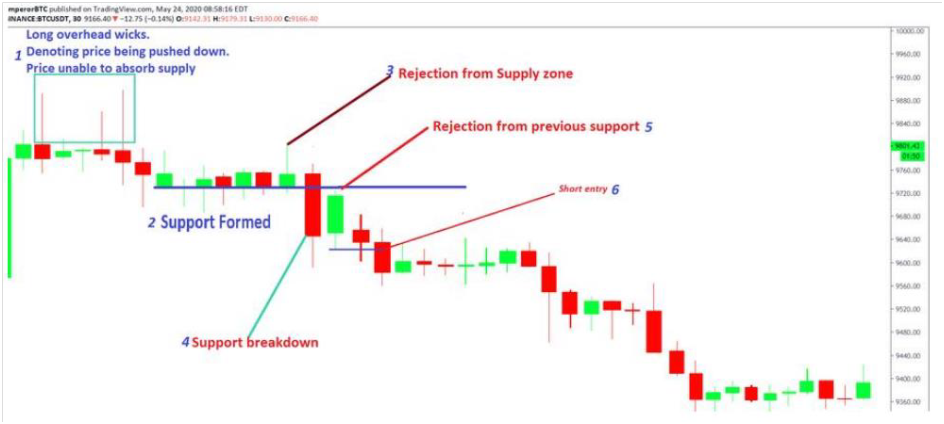
매도 구간 이후 숏 진입 지점을 찾는 법
1, 윗 꼬리 긴 캔들은 매도를 의미
2, 이 캔들들이 비슷한 선에서 끝나길 기다려라
3, 새로운 지지를 찾아라.
4, 깨지길 기다려라.
5, 그 지지선이 저항선이 되길 기다려라.
6, 확정되면 숏진입
| 이번 챕터에서 우리는 매수와 매도 개념, 차트에서 확인을 배웠다. 반복적인 활용으로 매수와 매도를 마스터하면 높은 확률의 진입 시점을 찾는 데 가장 쓸만한 도구가 될 것이다. 대부분의 초보자들은 이걸 상당히 늦게 알게 되어 좋은 진입 시점을 찾지 못한다. 매수지점 매도지점은 트레이딩에 들어오기 위한 도구가 아니라 매수 매도 구간 확인을 하고 수익률 좋은 지점을 찾아내기 위함이다. 차트에 캔들 종류를 확인 하는 것에 너무 많은 시간을 쓰는 대신, 우리는 어떤 캔들이 매수와 캔들 구조에 관해 보여주는지 집중해야 한다. 트레이더로서 우리의 진정한 목표는 추세를 확인 하는 것이다. (매수 매도가 더 있는 지 들어가야 할지) |
Now that we've completely understood a few important trading jargons,
let's begin with Technical Analysis.
| Technical Analysis is the use of charting techniques to predict future price movement. 1. It uses previous human reactions to a similar situation to predict future price movements. 2. Only price movement it taken into consideration while using technical analysis. All other information (like news, earnings) is not taken into consideration. |
It might come as a surprise to all new traders that news is disregarded while studying charts.
Murphy in his Book on technical analysis explains in detail why it is so.
To keep it short, the price discounts everything.
Market price of an asset already has taken into consideration all the fundamental news.
News, information and other analysis available in the public already have affected the price
and hence the price is an amalgamation of all the fundamental information.
Technical Analysis is the study of price; hence by studying price,
ALL the fundamentals have already been taking into consideration.
Hence, we can conclude that all the fundamentals affect the price.
Since the technical analysis is the study of price movement
it automatically takes all the fundamentals into consideration
CANDLESTICKS
Technical analysis starts and ends with Candlesticks.
A clear understanding of candlestick is a must to trade.
While the subject of Candlesticks is really vast,
there are only a few basics you need to understand.
The candlestick is used instead of a line chart
because a simple line chart doesn't tell the movement at a given period of time
whereas a candlestick tells you the high, low, open and close at a given time period.

There are 100s of kinds of Candlestick and it’s an unending study
but to start with I want to explain two important candles, hammer the Engulfing.
Hammer-
In simple terms, it’s a bottom reversal candle with a short body and long wick.
This can be spotted at potential bottoms.

Engulfing-
This occurs after a move is invalidated
because of a sudden price movement in the opposite direction by the next candle. Example below.

The basic concept and assumption while studying the candlesticks is
that a candle with long tail wick has seen the buyers being successful in pushing the price up
by buying at this price level even though there was a significant selling.
A candle with a short body long tail wick denotes supply absorption.

Similarly, a candle with a long overhead wick is bearish
and shows that even though the bulls tried to push the price up
the supply was too high for the price to go up.

Adding the above two we can conclude that a candle with a short body
and with both a long upper wick and a long lower wick is
a candle denoting indecision and confusion in the market.
It might denote a reversal or could act as a warning for an end of a trend
In this tutorial we will learn to identify the supply and demands zone on the chart
for entering high probability trade
before learning anything else this the topic to master
after reading this tutorial please open a live chart
and try to identify the supplies and demand zones
USING CANDLESTICKS TO FIND DEMAND AND SUPPLY
Apart from using candlesticks to identify price momentum in a certain time period,
candlesticks can be used to identify the demand and supplies ZONES
(demand and supply zone is different from support and resistance)
Using candlesticks to find the demand and supply zone is
a high probability method to find a profitable entry
since in the demand and supply zone there can be multiple entry triggers.
The aim after identifying demand and supply zones is
to enter at a point which has multiple entry triggers at one point.
FINDING SUPPLY AND DEMAND PRESSURE USING CANDLESTICKS.
Candlesticks can be used to find supply and demand pressure, especially in intra- day trading.
I hope this changes how you view and use candlesticks on a daily basis
Candlesticks with a long tail wick, about 2-3 times their body have overcome a big supply zone.
This means that below that candle existed a huge supply order which was absorbed.
This is generally bullish, means the demand in that zone was able to overcome the supply.
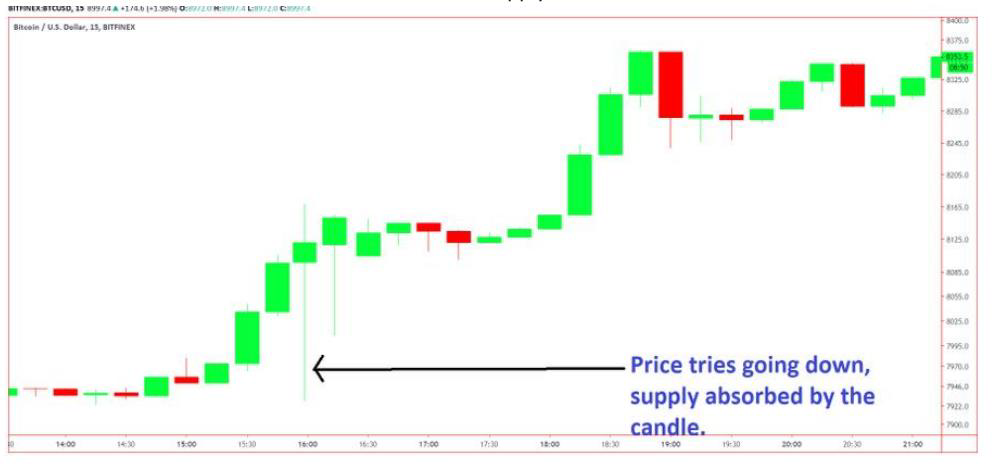
At this zone, traders could look for a safe long entry.
1. Look for candles with a long tail.
2. It should have bounced off of a previous resistance now turned support.
(WE WILL LEARN MORE ABOUT SUPPORT AND RESISTANCE IN THE NEXT LESSON,
FOR NOW ONLY CONCENTRATE ON DEMAND AND SUPPLY ZONE)
3. Wait for the price to break a resistance above.
The same principle is applicable with candles with a long overhead wick.
This implies that the candle was not able to absorb all the supply above itself,
which is generally bearish.
We should look for signs of reversal at this level

In a similar manner, on confirmation of a candle which failed to absorb the supply above,
a safe short entry can be made.
1. Look for candle with long overhead wick.
2. Wait for previous supply to be broken.
See pic below for a short entry.

Confirmation - A confirmation in trading is a positive signal to establish a bias for for an entry
Example- if the current candle looks bullish a safe entry with confirmation would be
when the price on the next candle goes above the highest price of the set bullish candle
Retest- After a price breaks a certain resistance it comes back to the point
where the resistance was to establish
that the resistance has been broken
and the same resistance has now been turned into a support for the price structure.
Let us try to understand the trade by using the following concepts of:
1. Demand Zone
2. Supply Zone
3. Uptrend line (A DETAILED TUTORIAL WILL BE UPLODED ON THIS)
4. Break-out
5. Retest
6. Confirmation

How to find a short entry after a supply zone:
1. Long overhead wick candles generally denote supply.
2. Wait for them to close at same level.
3. Find new support.
4. Wait for it to break.
5. Wait for support to turn into resistance.
6. Enter short trade upon confirmation.

So, in this tutorial we have learned the concept of supply and demand and how to identify on chart.
To reiterate, the use of supply and demand once mastered is the MOST useful tool
to find high probability trade entry.
Most beginners learn it very late hence are unable to identify high probability entry zones.
It must be noted that supply and demand zone is not a tool for entering a trade
but a tool for identifying the zones and areas of interest for high probability high profit trade.
Instead of spending too much time to identify the kind of candle stick that has been printed on a chart,
we should rather concentrate on what the candle is trying to say about the demand and candle structure.
As a trader our soul aim is to identify the trend (whether the demand and supply is more and enter it)
Please read this tutorial several times and try to identify the zones on your own on historical
charts.
DO NOT WORRY ABOUT FINDING THE ENTERY POINTS RIGHT NOW.
Only try to identify the zones finding entries will be taught in the next lessons.
I hope this tutorial was useful. This is the first trading lesson,
don’t worry or give up if you didn’t understand a few concepts. Always here to help.
Love,
EmperorBTC
출처 https://twitter.com/EmperorBTC
Emperor👑(@EmperorBTC) 님 | 트위터
@EmperorBTC 님 언뮤트하기 @EmperorBTC 님 뮤트하기 팔로우 @EmperorBTC 님 팔로우하기 팔로잉 @EmperorBTC 님 팔로우 중 언팔로우 @EmperorBTC 님 언팔로우하기 차단됨 @EmperorBTC 님이 차단됨 차단 해제 @EmperorBTC
twitter.com
사진을 클릭하시거나 아래 링크로 세계 1위 암호화폐 거래소 바이낸스에 가입해서
수수료 할인을 받으며 거래 해보세요!
New Binance customers can sign up to get the best Binance bonus through the link below
