캔들 심층 분석
Part1
지난 번에 우리는 아래 사항을 공부했다.
1, 매수 매도 구간
2, 캔들 도입
이번에는 좀 더 자세하게 주요 캔들에 관해서 이야기해보자.
캔들의 중요성
기술적 분석의 시작과 끝은 캔들이다. 캔들의 올바른 이해없이 트레이딩을 해서는 안된다.
| 기억해야 할 점 1, 캔들은 기술적 분석에서 가장 중요한 도구이긴 하지만, 나는 항상 캔들을 지지선 저항선이나 거래량 같은 다른 것들과 함께 활용한다. 2, 리스크 관리 없는 캔들 활용의 끝은 청산이다. 리스크 관리는 당신의 생각보다 훨씬 복잡하다. 나는 3개의 리스크 관리 코스를 만들었으니 트레이딩 하기 전에 꼭 읽어봐라. 3, 트레이딩 실전 경험 말고는 아무것도 트레이딩을 가르쳐 줄 수 없다. |
이 강의를 끝내자마자 실전이나 예전 차트에 연습을 해보고 지지 저항, 거래량이 어떤 역할을 하는 지 관찰해라.
캔들의 종류는 100가지가 넘지만, 나는 실제 트레이딩에 활용되는 가장 중요한 것들에 집중하겠다.
TIP:
캔들 종류 외우는 것에 집착하지말자. 캔들의 위치 속에 있는 논리만 이해해서 가격 예측에 활용하면 된다.
기본적인 캔들의 이해.
아래 그림에서 큰 부분이 캔들의 몸통이고 앏은 부분은 꼬리다.
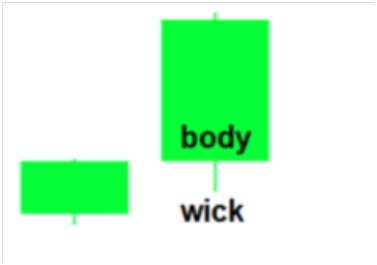
일반적 추정: 캔들 몸통이 길수록 매수나 매도세가 강함을 의미. 반대로 짧은 몸통은 가격 변동이 적고 횡보함을 나타낸다.

꼬리는 캔들이 가지고 있는 의미를 이해하는데 아주 중요한 역할을 한다. 매수와 매도의 싸움과 그 싸움의 승자를 알려준다.
다음 장에서 꼬리를 읽는 방법을 배워보자.
꼬리가 없는 경우
꼬리가 없고 몸통만 있는 캔들이 나올 때는 매수나 매도세가 가장 강한 경우이다. 마루보주 캔들로도 알려져있다.
예:


꼬리가 긴 경우
윗꼬리가 긴 경우
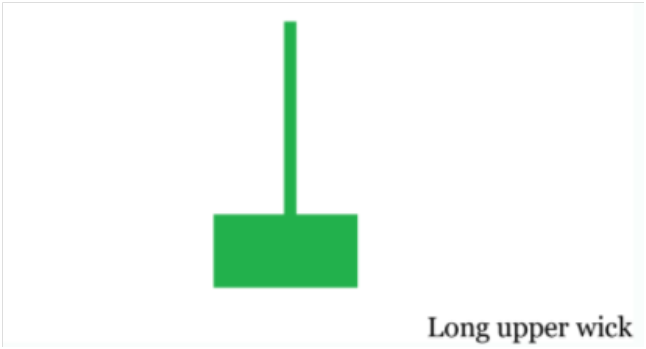
윗꼬리가 길고 몸통이 짧은 것은 매수 세력이 가격을 올리려고 했음에도 매도세력이 물량을 쏟아 부어 가격 상승을 누른 것이다.
아래꼬리가 긴 경우
아래꼬리가 길면 매도 세력이 가격을 낮추려고 했지만 매수 세력이 물량을 받아 먹고 가격을 위로 올린 것이다.

팽이형
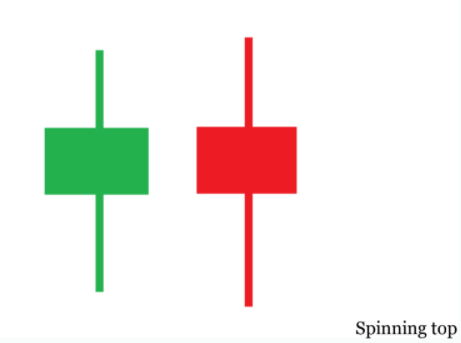
팽이형은 위 아래로 긴 꼬리를 달고 짧은 몸통을 가지고 있다. 이것은 방향이 결정되지 않았음을 의미한다.
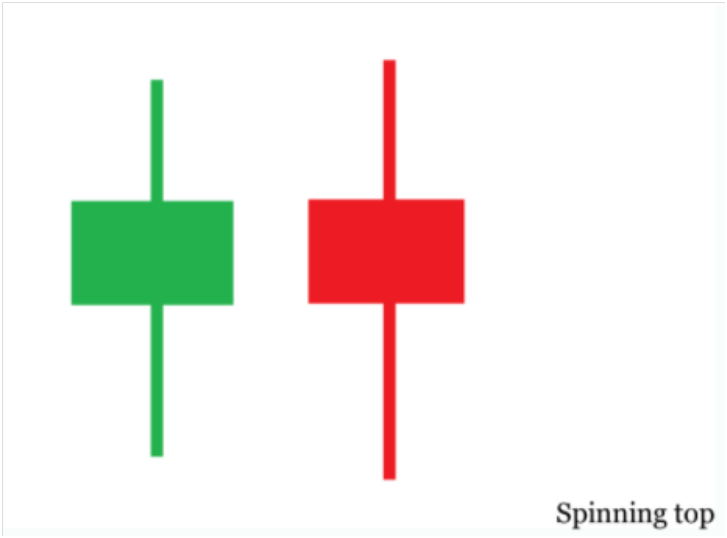
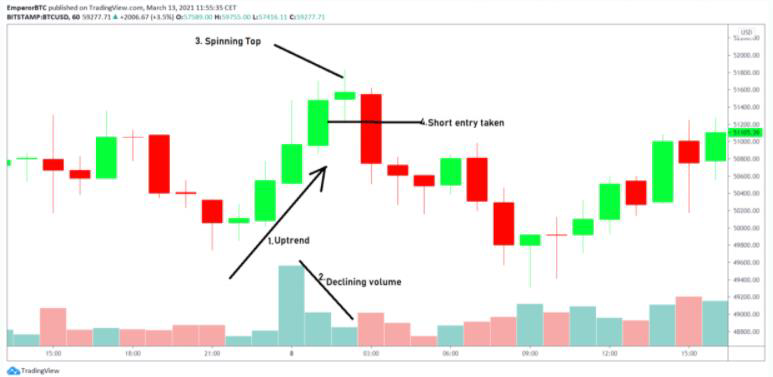
그렇지만, 팽이형이 추세의 천장이나 바닥에서 나타났다면 추세의 전환을 의미한다. 아래 차트에서 확인해보자.

TRADING BITCOIN MASTERCLASS
PART 2
Deep Dive into Candlesticks
Part 1
In the previous PDF, we studied:
1. Demand and Supply Zones
2. Introduction to Candlesticks
In this PDF, we will cover Candlesticks in some more detail, discussing the
major candlesticks and their types.
IMPORTANCE OF CANDLESTICKS
Technical Analysis starts and ends with Candlesticks.
Without proper understanding of Candlesticks, you should not be trading.
| Please note: 1. Candlesticks are the most important tool in Technical Analysis, however, I always use them in confirmation with OTHER confirmations like Support and Resistance and Volume. 2. Using Candlesticks without Risk Management will always lead to liquidation. Risk Management is far more complicated than you think, I've made 3 Masterclasses about Risk Management, PLEASE read them before trading 3. Nothing can teach you to trade but trading itself. |
As soon as you're done reading this pdf, go and practice the content on live or historical charts
and observe how volume and S/R play a role in them.
While there are 100s of types of Candlesticks,
I'm sticking to the most important ones that are actually practically used in trading.
Tip:
Don't get stuck in memorizing the names of the Candlesticks.
You need to understand the LOGIC behind their formation
and use that understanding to predict the future prices.
BASIC CANDLESTICK UNDERSTANDING
The fat part of the candle is called the candle body (candle open to close)
The thin line above and below the body is called the wick (highs and lows)

General assumption: the longer the candle body is, the more intense the buying or selling pressure.
Conversely, short candlestick bodies indicate little price movement and represent consolidation.

Wicks plays a really important part in understanding the STORY behind the candlesticks.
It shows the fight between the buyers and the sellers and who won it.
In continuation, we will learn to read the wicks.
NO WICKS
Candles existing of full body and no wicks showcase the highest buying and
selling pressure. These are known as Marubozu candles.
Example:


LONG WICKS
Long upper wick
Candles with long upper wick and short body below denotes that
even though the bulls tried to push the price higher,
the sellers took control and there was just too much supply at this point to push the price up.

Long lower wick
Candles with long lower wick (tail) indicates that the bears tried to push the price down
but the selling pressure was absorbed and the price managed to go up.

SPINNING TOP
Spinning top has long top and bottom wicks with a narrow body.
This implies indecision in the market.
However, if a spinning top appears at the top or bottom of the trend, it means a trend reversal.
This is explained in the chart below.
출처 https://twitter.com/EmperorBTC
Emperor👑(@EmperorBTC) 님 | 트위터
@EmperorBTC 님 언뮤트하기 @EmperorBTC 님 뮤트하기 팔로우 @EmperorBTC 님 팔로우하기 팔로잉 @EmperorBTC 님 팔로우 중 언팔로우 @EmperorBTC 님 언팔로우하기 차단됨 @EmperorBTC 님이 차단됨 차단 해제 @EmperorBTC
twitter.com
사진을 클릭하시거나 아래 링크로 세계 1위 암호화폐 거래소 바이낸스에 가입해서
수수료 할인을 받으며 거래 해보세요!
New Binance customers can sign up to get the best Binance bonus through the link below
