13, 지지/저항선이 돌파되면 어떻게 될까?
반대가 되어버린다.
지지선은 저항선이 되고 저항선은 지지선이 된다.
이 말은 추세를 이해하고 확인하는 것에 상당히 중요한 부분이다.

14, 저항선이 돌파되면 새로운 지지선이 되고 이 싸이클은 추세가 깨질 때까지 반복된다.
아래 차트를 면밀히서 관찰하여 어떻게 저항선이 저항을 하고(1) 돌파가 되고(2) 새로운 저항선에 부딪힌 다음(3) 새로운 지지선이 되는지(4) 살펴보라.

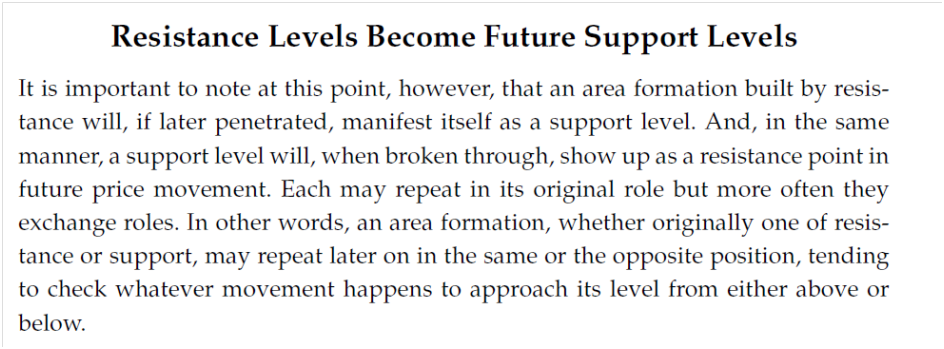
15, 이 싸이클은 하방돌파가 생길 때까지 지속 된다. 위 차트를 이해하기 위해 시간을 들여 살펴보라.
16, 지지와 저항의 활용
가격이 지지선에서 튀어 오를 때 롱 진입을 할 수 있고 저항선을 맞고 떨어질 때 숏포지션에 진입 할 수 있다.

17, 그렇지만 실제 트레이딩에서는 이렇게 단순하지 않다. 위에 나온 활용은 다음 사항의 이해가 필요하다.
- 상방돌파, 하방돌파
- 가짜 돌파
- 리테스트
- 확정
- 스탑 헌팅
이것들의 예는 아래를 보자.
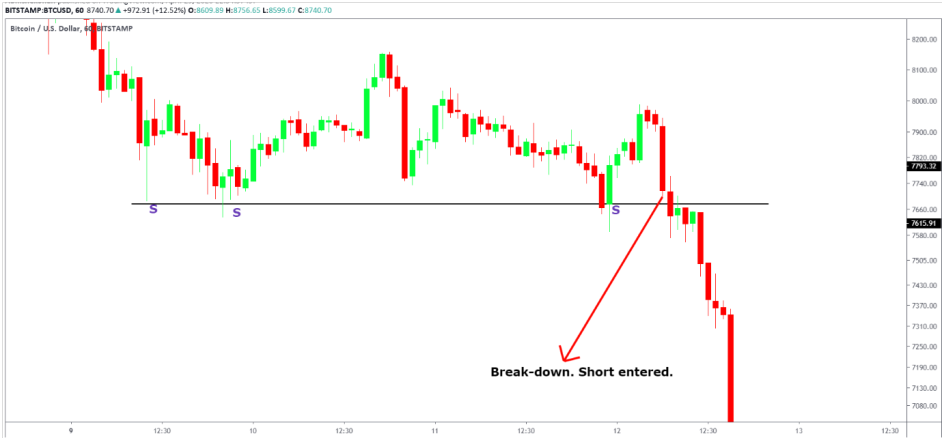
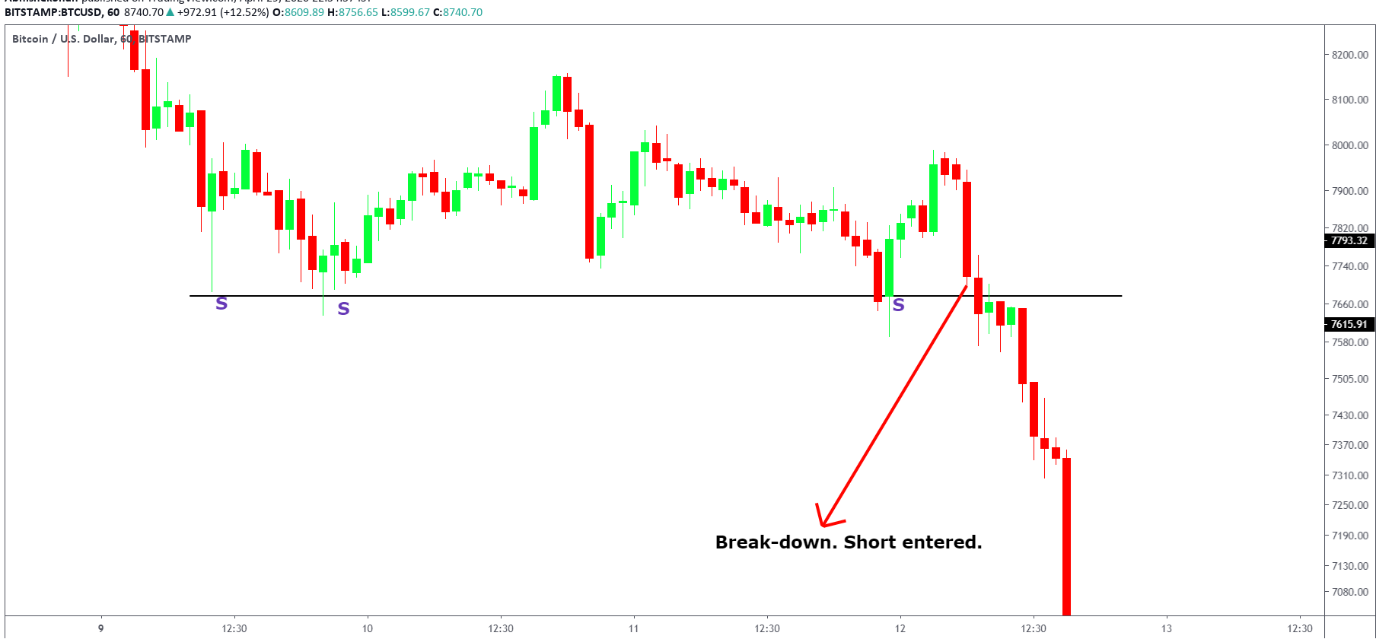
18, 지지와 저항으로 더 수익을 내려면 상방/하방 돌파 지역에서 사용해야 한다.
돌파는 저항선에서 거대한 매수로 인해 상방으로 강한 랠리를 이끌어낼 수 있다. 돌파에서 롱
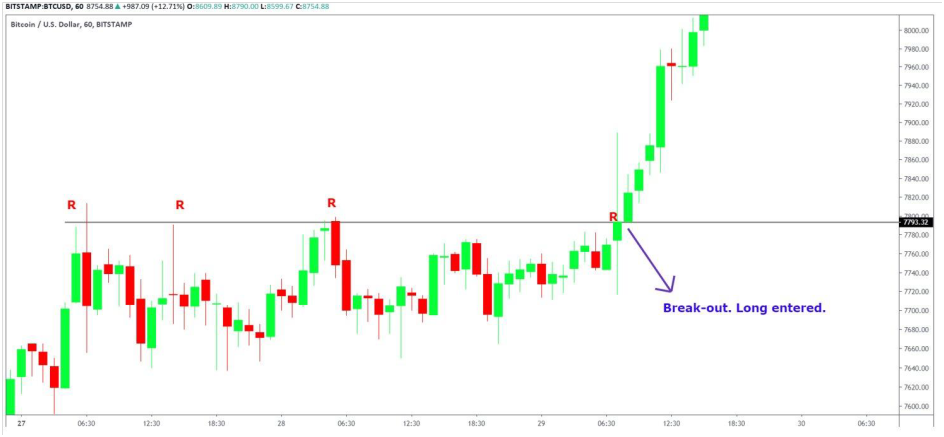
하방 돌파는 정확히 반대다. 강한 하락세를 이끌어 낼 수 있다. 하방 돌파에서 숏.
사진들을 참고 하자.
19, 지지와 저항 활용으로 수익률 좋은 진입 지점 찾기 심화
아래 그림에서 숙련된 트레이더가 수익률 좋은 자리에서 진입하는 것을 표현해봤다.
그렇지만 반복해서 읽어야 이해하기 쉽다.
20, 이번에 배워야 할 것
- 가짜 상방/하방 돌파
- 스탑로스 헌팅
이 두 가지를 공부하면 세력이 개미를 터는 방법을 이해하게 되고 스탑로스 헌팅에 대응 방안을 알려줄 것이다.
21, 세력은 개미들의 롱과 숏 포지션 스탑을 비슷한 가격대에서 동시에 털어버린다. 스탑헌팅은 개미들이 맞닥뜨리는 아주 일반적인 문제이다. 스탑헌팅을 자세히 이야기 해보자.
22, 저항선에서 숏 스탑 헌팅
빨간 선은 저항을 의미한다.
표시한 지점에서 어느 정도의 개미들은 저항에서 내려갈거라 생각하고 숏을 진입할 것이다.
그러나 가격은 약간의 돌파를 보여주며 숏 포지션이 손절하게 만든다.
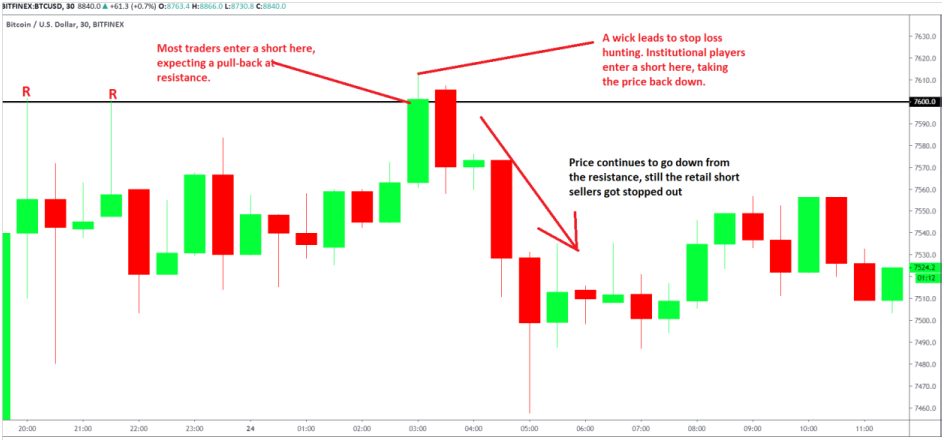
23, 이것이 가짜 돌파이다. 가격은 저항선으로 돌아간다. 하방으로 갔는데 손절선을 건들고 가버렸다. 트레이더들은 옳은 판단을 했음에도 돈을 잃는다. 이것이 숏 스탑헌팅이다.
24, 같은 차트 저항선에서 롱스탑 헌팅을 보자.
꼬리를 보면 저항선을 돌파했다. 대부분의 개미들은 여기서 돌파라고 생각하며 롱 진입을 한다. 그러나 가격은 반대로 가고 롱은 손절 하게된다. 이것이 롱 스탑헌팅이다.

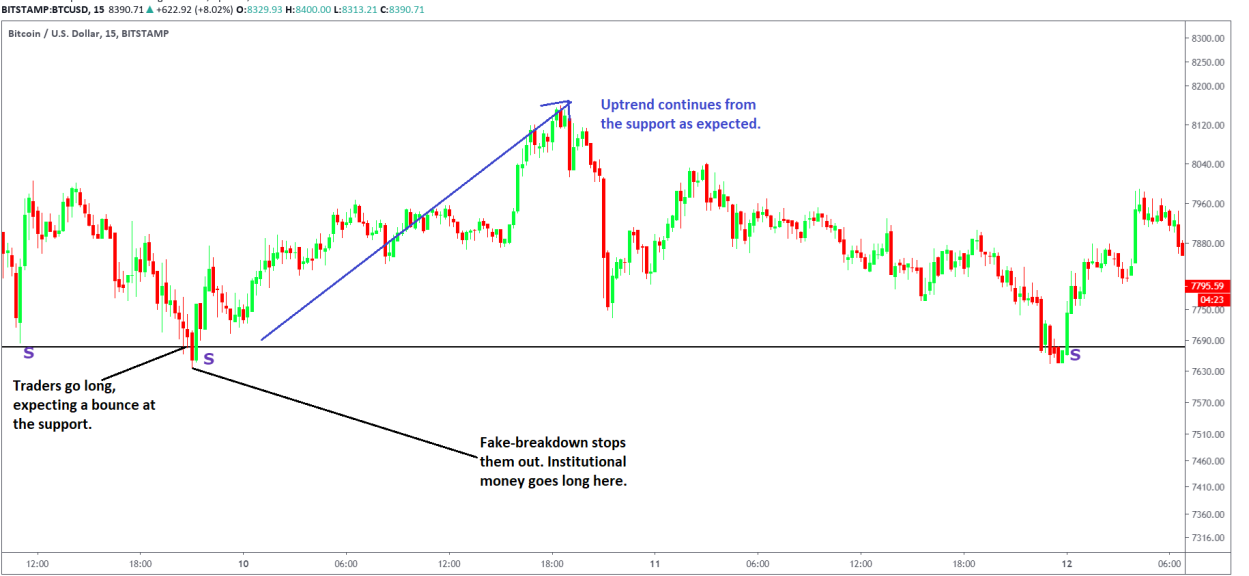
25, 지지선에서도 똑 같은 스탑헌팅이 일어난다. 롱과 숏 모두 지지선에서 당하는 것을 볼 수 있다.
아래 차트를 참고해보자.

지지/저항에서 포지션 진입이 스탑헌팅 당하는 것을 이해했으니 해결 방안을 살펴보자.
첫 번째 방법은 다음을 찾는 것이다.
1. 상방/하방 돌파
2. 리테스트
3. 돌파 방향으로 가격 진행
| 리테스트와 확정 절차는 롱과 숏 진입 모두에서 활용될 수 있다. 1. 상방/하방 돌파 확정 2. 지지 확정 3. 저항 확정 |
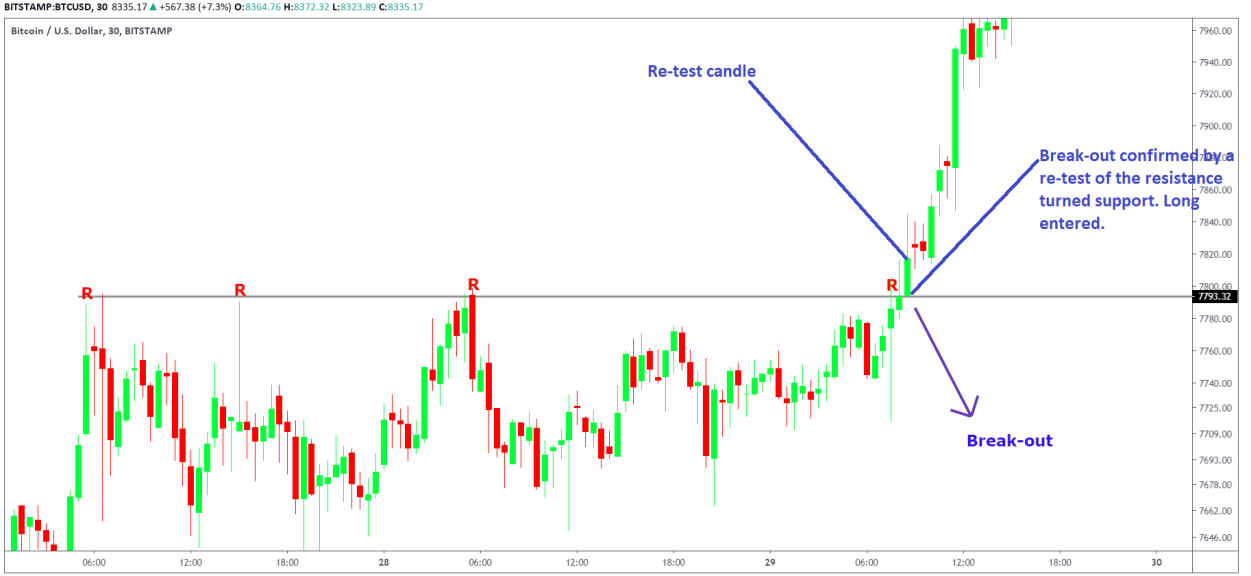
아래 차트에서 리테스트와 지지 확정을 확인해보자.

이 차트에서 지지가 발생했다. 가격이 다시 돌아가 리테스트 후 지지되고 확정되었다. 지지선이 확정된 것이다. 상방 랠리를 이끌어간다.
같은 식으로 아래 차트에서는 저항선 돌파 확정을 볼 수 있다. 저항선이 깨지고 가격이 내려오면서 리테스트 후 돌파가 확정되었다. 확정되면 수익률 좋은 롱 타점이 만들어진다.

두 번째 방법
돌파나 지지선에서 튀어 오른 이후 지지선이나 돌파 지역 위의 또 다른 저항 돌파를 기다려라.
아래 예시를 보자. 지지선을 맞고 올라가서 저항선을 돌파했을 때 롱 포지션에 진입했다.

같은 방식을 저항과 하방돌파에서의 숏포지션 진입에 활용 할 수 있다.
위와 같은 방법은 세력의 스탑헌팅을 피하는 것에 도움을 줄 것이다.
이런 시스템은 가로 지지/저항에서 당신이 필요한 모든 것을 심도있게 커버한다.
추세선 지지/저항, 매수/매도 구간에 관한 것도 곧 알려줄 것이니 이번 편을 여러 번 공부해라.
13. WHAT HAPPENS IF A SUPPORT OR RESISTANCE LINE BREAKS?
They start acting in the opposite nature.
A support line becomes a resistance and a resistance becomes a support.
This above concept is of utmost importance in understanding and confirming a TREND.
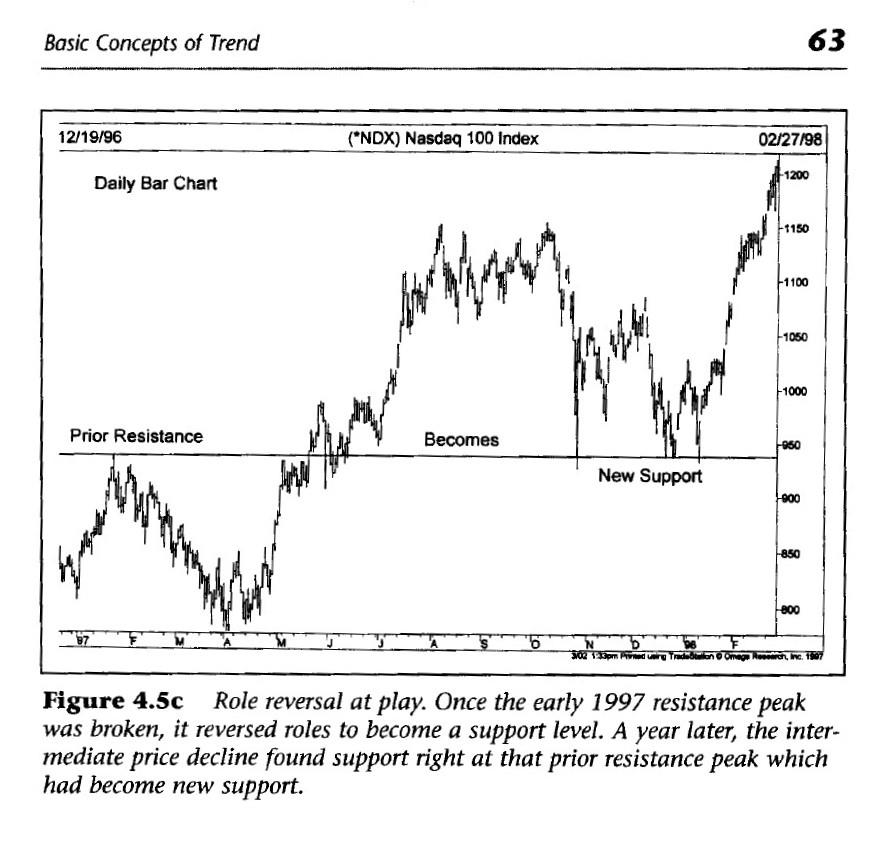
14. Resistance lines, when crossed, become new support, and the cycle repeats until the trend breaks. PIC
Study this chart carefully to see how Resistance level 1, when broken at 2,
after formation of a new resistance at 3, becomes a new support at 4.


15. This cycle continuous till the breakdown. Take some time to understand the above graph.
16. USES OF SUPPORT AND RESISTANCE
Intuitively the use of the support line would be to enter a long when the prices bounces off the support line
and that of the resistance line would be to go short when the price pulls back from resistance.

17. However, real world trading isn’t this simple and the above usage needs understanding of the following:
• Breakouts, Break-down
• Fake Breakdown/Breakout
• Re-tests
• Confirmations
• Stop-loss hunting
These are explained below:
18. One of the more profitable ways to use support and resistance is to use them at the Breakdown/Breakout zone.
A Breakout leads to a strong upwards rally in price because of a huge demand at the resistance zone.
Long at the Break-out.

The exact opposite is true for breakdown, which leads to a big pullback in price. Short at the break-down.
See pic below for Break-out and Break-Down
19. Advanced uses of Support and resistance in determining high probability entry.
Below I illustrate the advanced practices used by seasoned traders to determine high probability entries for profits.
However, they are easy to understand upon a repeated reading.
20. HERE WE WILL STUDY:
1. Fake Breakouts and Fake Breakdowns
2. Stop loss hunting
Study of the above will help us understand how institutional traders stop out the retail traders
and provide us with a probable solution against stop loss hunting.
21.Institutional traders stop out BOTH Long and Short retail traders, at the same time, at a similar price zone.
A very common problem that retail traders face is being stopped out.
Let us understand stop loss hunting in detail.
22. SHORT HUNTING AT RESISTANCE
The red line denotes the resistance line.
At Point A, few retail traders will short it thinking that the price will go down at the resistance.
But the price has a small breakout out. Triggering the stop loss of the people who went short.
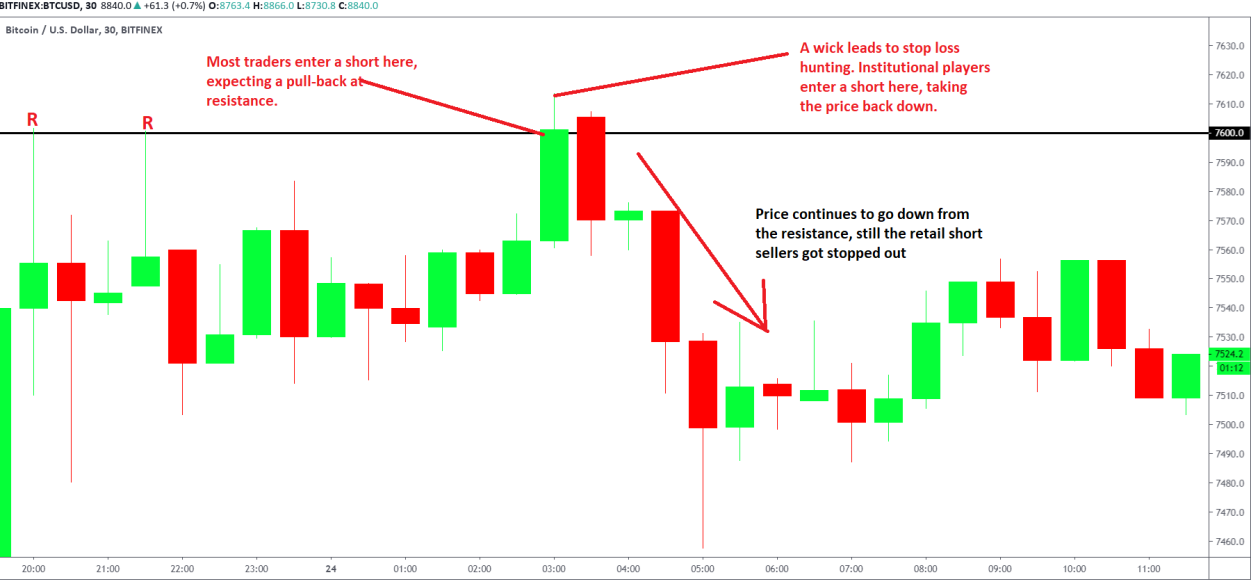
23. This is a fake out as the price then reverses at the resistance.
Even though the price goes down, the stop loss gets hit.
Here the trader loses money even after being right. This is short hunting.
24. With the same chart, we will study long hunting at the resistance.
The wick crosses above the resistance line, most retail traders will long here, calling it a breakout.
The price is then reversed. Stopping out all the longs. This is long hunting at the resistance.

25.The same exact stop loss hunting is done at the support.
Stop loss hunting for longs and shorts at the support can be seen here.
This is illustrated in the charts below.
Now that we have understood that taking long/short entries at the support and resistance can get you stopped out, let us look at the probable solution.
First solution is to look for the following
1. Breakout/Breakdown
2. RE-TEST
3. Follow through
| The process of Confirmation and Retest can be used for both long and short entries 1. Confirming the Breakout 2. Confirming the breakdown 3. Confirming the support 4. Confirming the resistance |
This chart explains the re-test and confirmation of support

In this chart, the support is established.
Then the price comes back to be retested and the support is held and confirmed.
This confirms the support line. Leading to an upwards rally.
In the same manner, a breakout from a resistance can be confirmed as shown in this chart.
The resistance is broken. The price comes back to confirms the breakout and is confirmed.
On confirmation, a high probability long entry is made.
2ND SOLUTION
After a break-out or a bounce from the support like, wait for the price to break another resistance above the support line
or the break-out levels.
See the example below for entering a long after a bounce at support and break of resistance.

The same concepts can be applied for going short at resistance or breakdowns.
The above concepts will help all beginners from stop getting hunted by an institutional order block.
This module has covered ALL the information you need about horizontal support and resistance in great depth.
I will share trend-ine support and resistance and Supply and Demand zone tutorials soon. Study it multiple times and you should be good to go.
출처 https://twitter.com/EmperorBTC
Emperor👑(@EmperorBTC) 님 | 트위터
@EmperorBTC 님 언뮤트하기 @EmperorBTC 님 뮤트하기 팔로우 @EmperorBTC 님 팔로우하기 팔로잉 @EmperorBTC 님 팔로우 중 언팔로우 @EmperorBTC 님 언팔로우하기 차단됨 @EmperorBTC 님이 차단됨 차단 해제 @EmperorBTC
twitter.com
사진을 클릭하시거나 아래 링크로 세계 1위 암호화폐 거래소 바이낸스에 가입해서
수수료 할인을 받으며 거래 해보세요!
New Binance customers can sign up to get the best Binance bonus through the link below
